Next Launch
Total Students
2,609
Total Launches
683
Eggs Survived
418 61.2%
Rockets Survived
536 78.5%
Dec. 1, 2012
Partnering to Solve Saturn's Mysteries
by Diane K. Fisher
From December 2010 through mid-summer 2011, a giant storm raged in Saturn's northern hemisphere. It was clearly visible not only to NASA's Cassini spacecraft orbiting Saturn, but also astronomers here on Earth-even those watching from their back yards. The storm came as a surprise, since it was about 10 years earlier in Saturn's seasonal cycle than expected from observations of similar storms in the past. Saturn's year is about 30 Earth years. Saturn is tilted on its axis (about 27° to Earth's 23°), causing it to have seasons as Earth does.
But even more surprising than the unseasonal storm was the related event that followed.
First, a giant bubble of very warm material broke through the clouds in the region of the now-abated storm, suddenly raising the temperature of Saturn's stratosphere over 150 °F. Accompanying this enormous "burp" was a sudden increase in ethylene gas. It took Cassini's Composite Infrared Spectrometer instrument to detect it.
According to Dr. Scott Edgington, Deputy Project Scientist for Cassini, "Ethylene [C2H4] is normally present in only very low concentrations in Saturn's atmosphere and has been very difficult to detect. Although it is a transitional product of the thermochemical processes that normally occur in Saturn's atmosphere, the concentrations detected concurrent with the big 'burp' were 100 times what we would expect."
So what was going on?
Chemical reaction rates vary greatly with the energy available for the process. Saturn's seasonal changes are exaggerated due to the effect of the rings acting as venetian blinds, throwing the northern hemisphere into shade during winter. So when the Sun again reaches the northern hemisphere, the photochemical reactions that take place in the atmosphere can speed up quickly. If not for its rings, Saturn's seasons would vary as predictably as Earth's.
But there may be another cycle going on besides the seasonal one. Computer models are based on expected reaction rates for the temperatures and pressures in Saturn's atmosphere, explains Edgington. However, it is very difficult to validate those models here on Earth. Setting up a lab to replicate conditions on Saturn is not easy!
Also contributing to the apparent mystery is the fact that haze on Saturn often obscures the view of storms below. Only once in a while do storms punch through the hazes. Astronomers may have previously missed large storms, thus failing to notice any non-seasonal patterns.
As for atmospheric events that are visible to Earth-bound telescopes, Edgington is particularly grateful for non-professional astronomers. While these astronomers are free to watch a planet continuously over long periods and record their finding in photographs, Cassini and its several science instruments must be shared with other scientists. Observation time on Cassini is planned more than six months in advance, making it difficult to immediately train it on the unexpected. That's where the volunteer astronomers come in, keeping a continuous watch on the changes taking place on Saturn.
Edgington says, "Astronomy is one of those fields of study where amateurs can contribute as much as professionals."
Go to http://saturn.jpl.nasa.gov/ to read about the latest Cassini discoveries. For kids, The space Place has lots of ways to explore Saturn at http://spaceplace.nasa.gov/search/cassini/.
This article was provided by the Jet Propulsion Laboratory, California Institute of Technology, under a contract with the National Aeronautics and Space Administration.
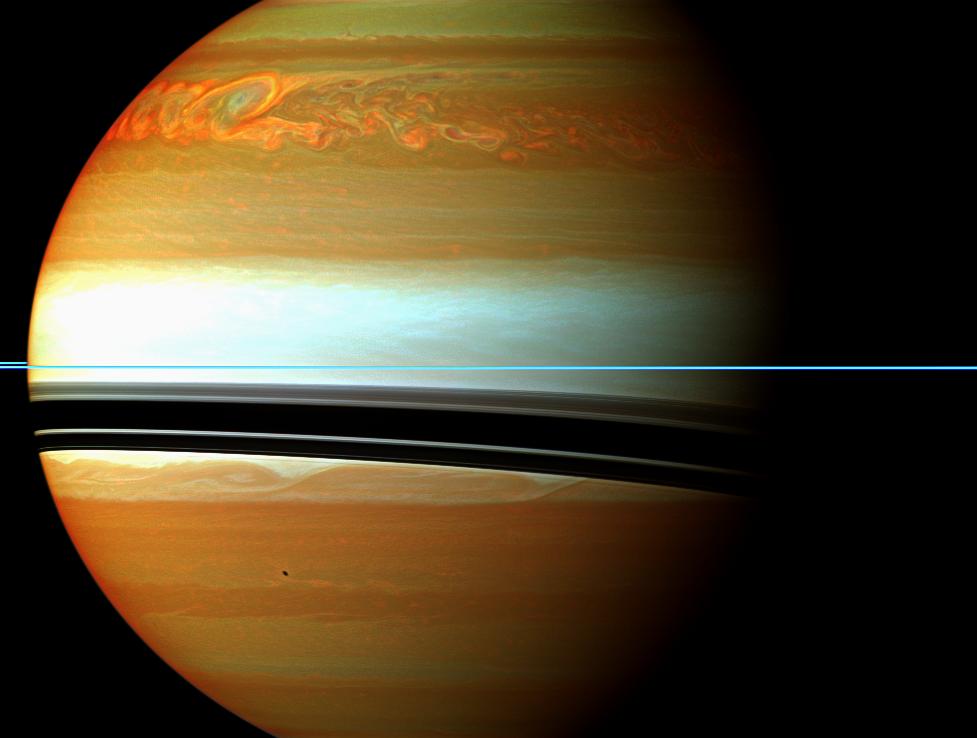 This false-colored Cassini image of Saturn was taken in near-infrared light on January 12, 2011. Red and orange show clouds deep in the atmosphere. Yellow and green are intermediate clouds. White and blue are high clouds and haze. The rings appear as a thin, blue horizontal line.
Jan. 1, 2013
The Art of Space Imagery
by Diane K. Fisher
When you see spectacular space images taken in infrared light by the Spitzer Space Telescope and other non-visible-light telescopes, you may wonder where those beautiful colors came from? After all, if the telescopes were recording infrared or ultraviolet light, we wouldn't see anything at all. So are the images "colorized" or "false colored"?
No, not really. The colors are translated. Just as a foreign language can be translated into our native language, an image made with light that falls outside the range of our seeing can be "translated" into colors we can see. Scientists process these images so they can not only see them, but they can also tease out all sorts of information the light can reveal. For example, wisely done color translation can reveal relative temperatures of stars, dust, and gas in the images, and show fine structural details of galaxies and nebulae.
Spitzer's Infrared Array Camera (IRAC), for example, is a four-channel camera, meaning that it has four different detector arrays, each measuring light at one particular wavelength. Each image from each detector array resembles a grayscale image, because the entire detector array is responding to only one wavelength of light. However, the relative brightness will vary across the array.
So, starting with one detector array, the first step is to determine what is the brightest thing and the darkest thing in the image. Software is used to pick out this dynamic range and to re-compute the value of each pixel. This process produces a grey-scale image. At the end of this process, for Spitzer, we will have four grayscale images, one for each for the four IRAC detectors.
Matter of different temperatures emit different wavelengths of light. A cool object emits longer wavelengths (lower energies) of light than a warmer object. So, for each scene, we will see four grayscale images, each of them different.
Normally, the three primary colors are assigned to these gray-scale images based on the order they appear in the spectrum, with blue assigned to the shortest wavelength, and red to the longest. In the case of Spitzer, with four wavelengths to represent, a secondary color is chosen, such as yellow. So images that combine all four of the IRAC's infrared detectors are remapped into red, yellow, green, and blue wavelengths in the visible part of the spectrum.
Download a new Spitzer poster of the center of the Milky Way. On the back is a more complete and colorfully-illustrated explanation of the "art of space imagery." Go to spaceplace.nasa.gov/posters/#milky-way.
This article was provided by the Jet Propulsion Laboratory, California Institute of Technology, under a contract with the National Aeronautics and Space Administration.
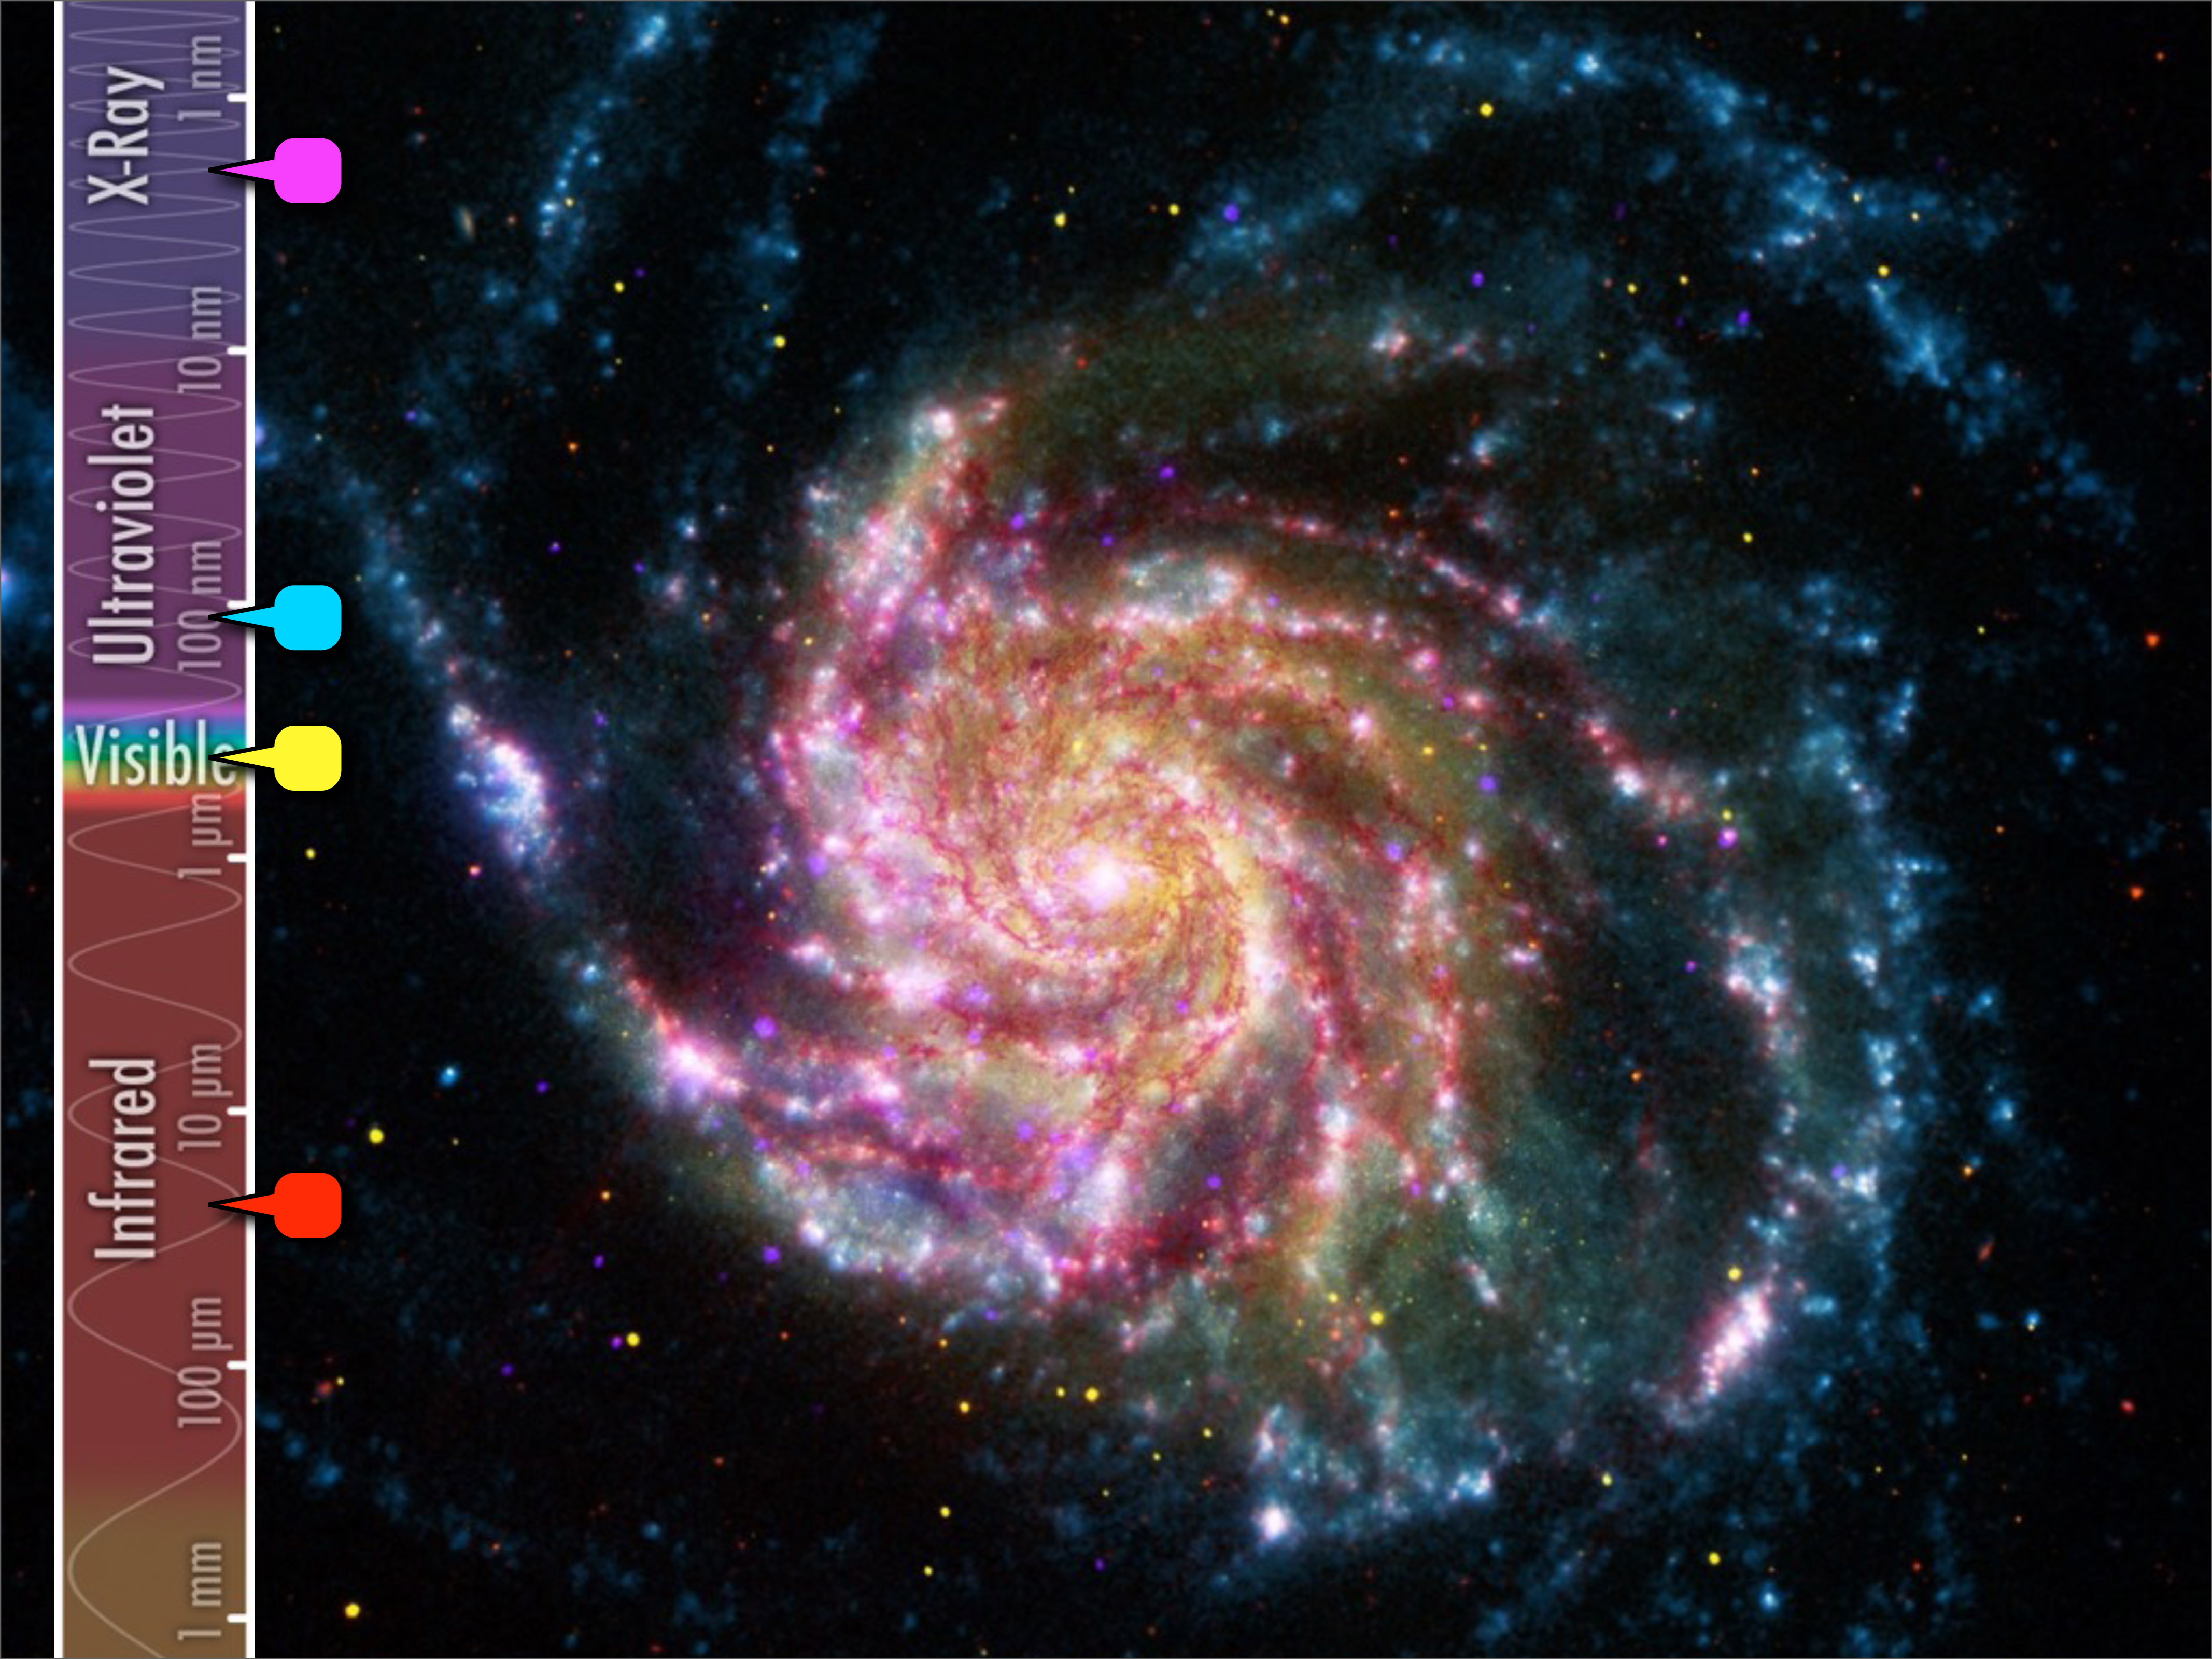 This image of M101 combines images from four different telescopes, each detecting a different part of the spectrum. Red indicates infrared information from Spitzer's 24-micron detector, and shows the cool dust in the galaxy. Yellow shows the visible starlight from the Hubble telescope. Cyan is ultraviolet light from the Galaxy Evolution Explorer space telescope, which shows the hottest and youngest stars. And magenta is X-ray energy detected by the Chandra X-ray Observatory, indicating incredibly hot activity, like accretion around black holes.
Feb. 1, 2013
Tackling the Really BIG Questions
by Diane K. Fisher
How does NASA get its ideas for new astronomy and astrophysics missions? It starts with a Decadal Survey by the National Research Council, sponsored by NASA, the National Science Foundation, and the Department of Energy. The last one, New Worlds, New Horizons in Astronomy and Astrophysics was completed in 2010. It defines the highest-priority research activities in the next decade for astronomy and astrophysics that will "set the nation firmly on the path to answering profound questions about the cosmos." It defines space- and ground-based research activities in the large, midsize, and small budget categories.
The recommended activities are meant to advance three science objectives:
- Deepening understanding of how the first stars, galaxies, and black holes formed,
- Locating the closest habitable Earth-like planets beyond the solar system for detailed study, and
- Using astronomical measurements to unravel the mysteries of gravity and probe fundamental physics.
For the 2012-2021 period, the highest-priority large mission recommended is the Wide-field Infrared Survey Telescope (WFIRST). It would orbit the second Lagrange point and perform wide-field imaging and slitless spectroscopic surveys of the near-infrared sky for the community. It would settle essential questions in both exoplanet and dark energy research and would advance topics ranging from galaxy evolution to the study of objects within the galaxy and within the solar system. Naturally, NASA?s strategic response to the recommendations in the Decadal Survey must take budget constraints and uncertainties into account.
The goal is to begin building this mission in 2017, after the launch of the James Webb Space Telescope. But this time frame is not assured. Alternatively, a different, less ambitious mission that also address the Decadal Survey science objectives for WFIRST would remain a high priority.
The Astrophysics Division is also doing studies of moderate-sized missions, including: gravitational wave mission concepts that would advance some or all of the science objectives of the Laser Interferometer Space Antenna (LISA), but at lower cost; X-ray mission concepts to advance the science objectives of the International X-ray Observatory (IXO), but at lower cost; and mission concept studies of probe-class missions to advance the science of a planet characterization and imaging mission.
For a summary of NASA?s plans for seeking answers to the big astrophysics questions and to read the complete Astrophysics Implementation Plan (dated December 2012), see http://science.nasa.gov/astrophysics/. For kids, find lots of astrophysics fun facts and games on The Space Place, http://spaceplace.nasa.gov/menu/space/.
This article was provided by the Jet Propulsion Laboratory, California Institute of Technology, under a contract with the National Aeronautics and Space Administration.
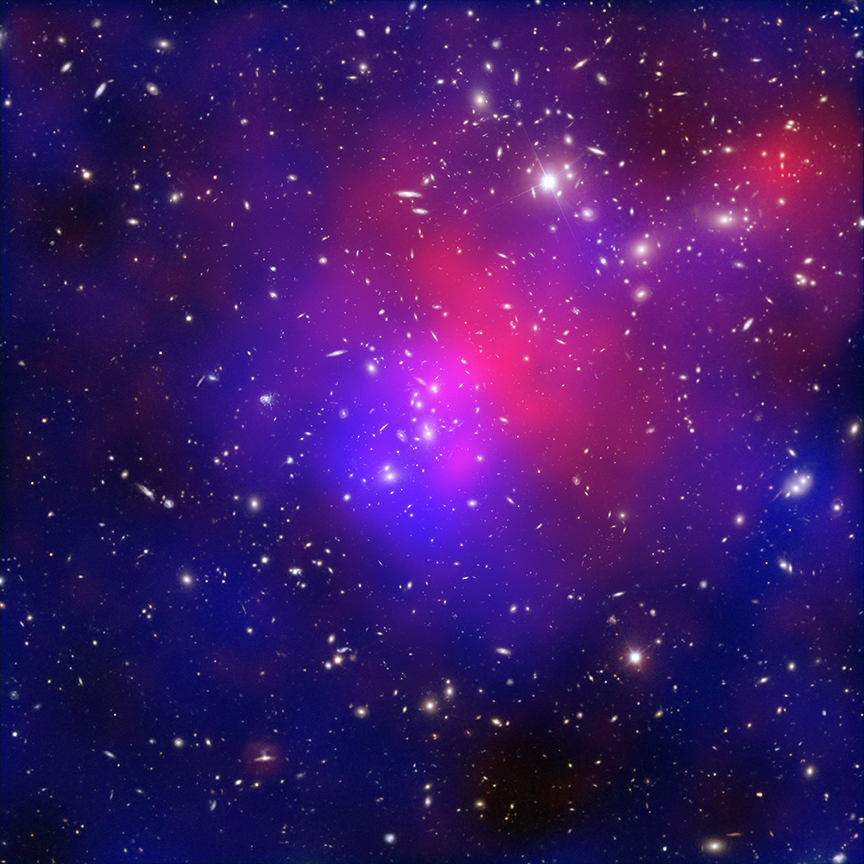 Clusters of galaxies collide in this composite image of ?Pandora's Cluster.? Data (in red) from NASA's Chandra X-ray Observatory show gas with temperatures of millions of degrees. Blue maps the total mass concentration (mostly dark matter) based on data from the Hubble Space Telescope (HST), the European Southern Observatory's Very Large Telescope (VLT), and the Japanese Subaru telescope. Optical data from HST and VLT also show the constituent galaxies of the clusters. Such images begin to reveal the relationship between concentration of dark matter and the overall structure of the universe.
March 1, 2013
Your Daily Dose of Astonishment
by Diane K. Fisher
As a person vitally interested in astronomy, you probably have the Astronomy Picture of the Day website at apod.nasa.gov/apod/astropix.html set as favorite link. APOD has been around since practically the beginning of the web. The first APOD appeared unannounced on June 16, 1995. It got 15 hits. The next picture appeared June 20, 1995, and the site has not taken a day off since. Now daily traffic is more like one million hits.
Obviously, someone is responsible for picking, posting, and writing the detailed descriptions for these images. Is it a whole team of people? No. Surprisingly, it is only two men, the same ones who started it and have been doing it ever since.
Robert Nemiroff and Jerry Bonnell shared an office at NASA's Goddard Space Flight Center in the early-90s, when the term "World Wide Web" was unknown, but a software program called Mosaic could connect to and display specially coded content on other computers. The office mates thought "we should do something with this."
Thus was conceived the Astronomy Picture of the Day. Now, in addition to the wildly popular English version, over 25 mirror websites in other languages are maintained independently by volunteers. (See http://apod.nasa.gov/apod/lib/about_apod.html for links). An archive of every APOD ever published is at href="http://apod.nasa.gov/apod/archivepix.html. Dr. Nemiroff also maintains a discussion website at http://asterisk.apod.com/.
But how does it get done? Do these guys even have day jobs?
Dr. Nemiroff has since moved to Michigan Technological University in Houghton, Michigan, where he is professor of astrophysics, both teaching and doing research. Dr. Bonnell is still with NASA, an astrophysicist with the Compton Gamma Ray Observatory Science Support Center at Goddard. APOD is only a very small part of their responsibilities. They do not collaborate, but rather divide up the calendar, and each picks the image, writes the description, and includes the links for the days on his own list. The files are queued up for posting by a "robot" each day.
They use the same tools they used at the beginning: Raw HTML code written using the vi text editor in Linux. This simple format has now become such a part of the brand that they would upset all the people and websites and mobile apps that link to their feed if they were to change anything at this point.
Where do they find the images? Candidates are volunteered from large and small observatories, space telescopes (like the Hubble and Spitzer), and independent astronomers and astro-photographers. The good doctors receive ten images for every one they publish on APOD. But, as Dr. Nemiroff emphasizes, being picked or not picked is no reflection on the value of the image. Some of the selections are picked for their quirkiness. Some are videos instead of images. Some have nothing to do with astronomy at all, like the astonishing August 21, 2012, video of a replicating DNA molecule.
Among the many mobile apps taking advantage of the APOD feed is Space Place Prime, a NASA magazine that updates daily with the best of NASA. It's available free (in iOS only at this time) at the Apple Store.
This article was provided by the Jet Propulsion Laboratory, California Institute of Technology, under a contract with the National Aeronautics and Space Administration.
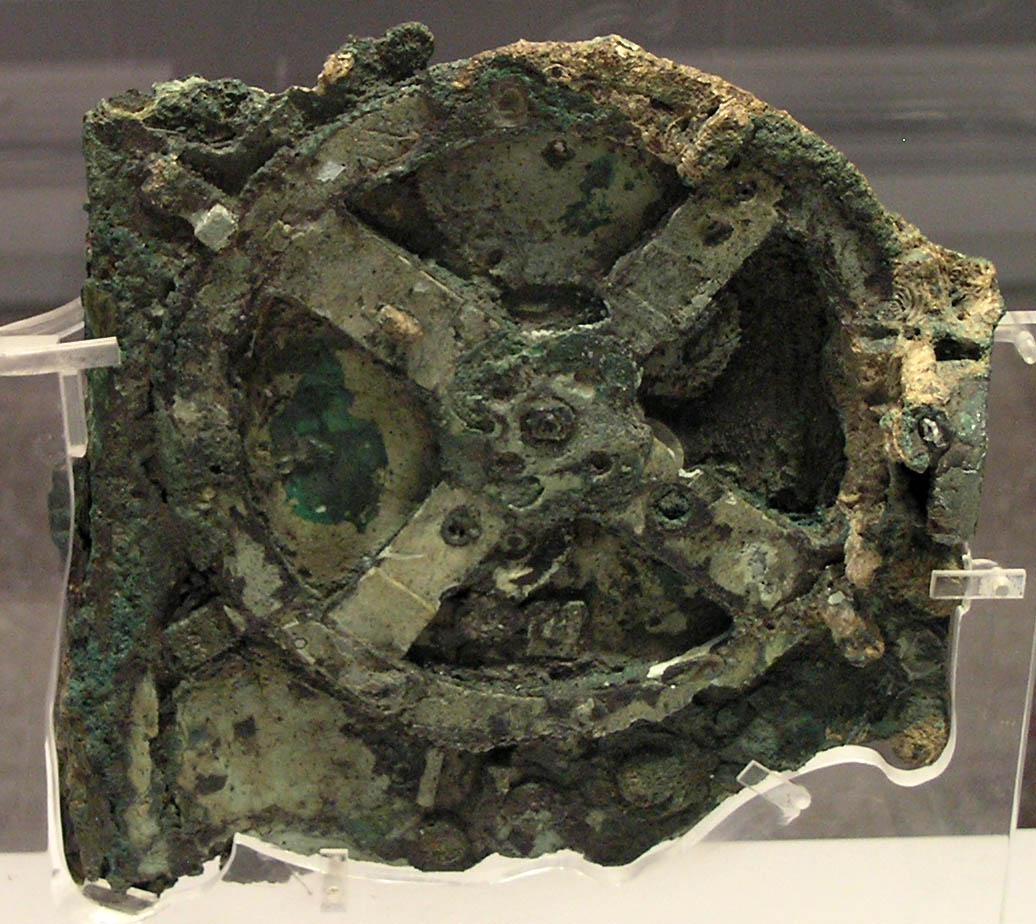 The January 20, 2013, Astronomy Picture of the Day is one that might fall into the "quirky" category. The object was found at the bottom of the sea aboard a Greek ship that sank in 80 BCE. It is an Antikythera mechanism, a mechanical computer of an accuracy thought impossible for that era. Its wheels and gears create a portable orrery of the sky that predicts star and planet locations as well as lunar and solar eclipses.