Next Launch
Total Students
2,609
Total Launches
683
Eggs Survived
418 61.2%
Rockets Survived
536 78.5%
March 1, 2008
Tracking Wildlife from Space
by Patrick Barry
It's 10 o'clock, and do you know where your Oriental Honey Buzzard is?
Tracking the whereabouts of birds and other migrating wildlife across thousands of miles of land, air, and sea is no easy feat. Yet to protect the habitats of endangered species, scientists need to know where these roving animals go during their seasonal travels.
Rather than chasing these animals around the globe, a growing number of scientists are leveraging the bird's-eye view of orbiting satellites to easily monitor animals' movements anywhere in the world.
The system piggybacks on weather satellites called Polar Operational Environmental Satellites, which are operated by the National Oceanic and Atmospheric Administration (NOAA), as well as a European satellite called MetOp. Sensors aboard these satellites pick up signals beamed from portable transmitters on the Earth's surface, 850 kilometers below. NOAA began the project—called Argos—in cooperation with NASA and the French space agency (CNES) in 1974. At that time, scientists placed these transmitters primarily on buoys and balloons to study the oceans and atmosphere. As electronics shrank and new satellites' sensors became more sensitive, the transmitters became small and light enough by the 1990s that scientists could mount them safely on animals. Yes, even on birds like the Oriental Honey Buzzard.
“Scientists just never had the capability of doing this before,” says Christopher O'Connors, Program Manager for Argos at NOAA.
Today, transmitters weigh as little as 1/20th of a pound and require a fraction of a watt of power. The satellites can detect these feeble signals in part because the transmitters broadcast at frequencies between 401 and 403 MHz, a part of the spectrum reserved for environmental uses. That way there's very little interference from other sources of radio noise.
“Argos is being used more and more for animal tracking,” O’Connors says. More than 17,000 transmitters are currently being tracked by Argos, and almost 4,000 of them are on wildlife. “The animal research has been the most interesting area in terms of innovative science.”
For example, researchers in Japan used Argos to track endangered Grey-faced Buzzards and Oriental Honey Buzzards for thousands of kilometers along the birds' migrations through Japan and Southeast Asia. Scientists have also mapped the movements of loggerhead sea turtles off the west coast of Africa. Other studies have documented migrations of wood storks, Malaysian elephants, porcupine caribou, right whales, and walruses, to name a few.
Argos data is available online at www.argos-system.org, so every evening, scientists can check the whereabouts of all their herds, schools, and flocks. Kids can learn about some of these endangered species and play a memory game with them at http://spaceplace.nasa.gov/en/kids/poes_tracking.
This article was provided by the Jet Propulsion Laboratory, California Institute of Technology, under a contract with the National Aeronautics and Space Administration.
April 1, 2008
Stellar Compass for Space Explorers
by Patrick L. Barry
In space, there's no up or down, north or south, east or west. So how can robotic spacecraft know which way they're facing when they fire their thrusters, or when they try to beam scientific data back to Earth?
Without the familiar compass points of Earth's magnetic poles, spacecraft use stars and gyros to know their orientation. Thanks to a recently completed test flight, future spacecraft will be able to do so using only an ultra-low-power camera and three silicon wafers as small as your pinky fingernail.
"The wafers are actually very tiny gyros," explains Artur Chmielewski, project manager at JPL for Space Technology 6 (ST6), a part of NASA's New Millennium Program.
Traditional gyros use spinning wheels to detect changes in pitch, yaw, and roll—the three axes of rotation. For ST6's Inertial Stellar Compass, the three gyros instead consist of silicon wafers that resemble microchips. Rotating the wafers distorts microscopic structures on the surfaces of these wafers in a way that generates electric signals. The compass uses these signals—along with images of star positions taken by the camera—to measure rotation.
Because the Inertial Stellar Compass (ISC) is based on this new, radically different technology, NASA needed to flight-test it before using it in important missions. That test flight reached completion in December 2007 after about a year in orbit aboard the Air Force's TacSat-2 satellite.
"It just performed beautifully," Chmielewski says. "The data checked out really well." The engineers had hoped that ISC would measure the spacecraft's rotation with an accuracy of 0.1 degrees. In the flight tests, ISC surpassed this goal, measuring rotation to within about 0.05 degrees.
That success paves the way for using ISC to reduce the cost of future science missions. When launching probes into space, weight equals money. "If you're paying a million dollars per kilogram to send your spacecraft to Mars, you care a lot about weight," Chmielewski says. At less than 3 kilograms, ISC weighs about one-fifth as much as traditional stellar compasses. It also uses about one-tenth as much power, so a spacecraft would be able to use smaller, lighter solar panels.
Engineers at Draper Laboratory, the Cambridge, Massachusetts, company that built the ISC, are already at work on a next-generation design that will improve the compass's accuracy ten-fold, Chmielewski says. So ISC and its successors could soon help costs--and spacecraft--stay on target.
Find out more about the ISC at https://science.nasa.gov/missions/st6. Kids can do a fun project and get an introduction to navigating by the stars at spaceplace.nasa.gov/en/kids/st6starfinder/st6starfinder.shtml.
This article was provided by the Jet Propulsion Laboratory, California Institute of Technology, under a contract with the National Aeronautics and Space Administration.
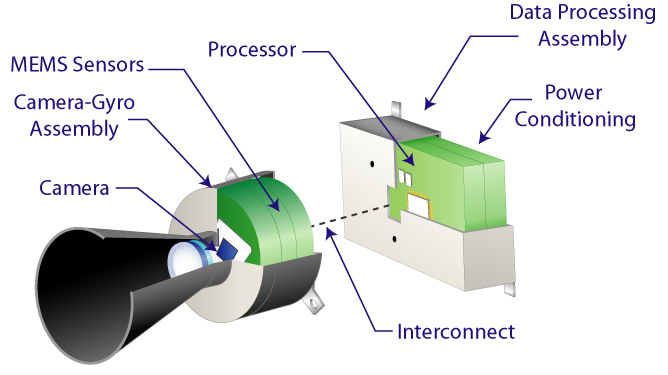 Compass is built as two separate assemblies, the camera-gyro assembly and the data processor assembly, connected by a wiring harness. The technology uses an active pixel sensor in a wide-field-of-view miniature star camera and micro-electromechanical sys
Aug. 1, 2008
A Google for Satellites: Sensor Web 2.0
by Staff writer
If you could see every satellite passing overhead each day, it would look like a chaotic meteor shower in slow motion.
Hundreds of satellites now swarm over the Earth in a spherical shell of high technology. Many of these satellites gaze at the planet’s surface, gathering torrents of scientific data using a dizzying array of advanced sensors — an extraordinary record of our dynamic planet.
To help people tap into this resource, NASA researchers such as Daniel Mandl are developing a “Google for satellites,” a web portal that would make requesting data from Earth-observing satellites almost as easy as typing a search into Google.
“You just click on it and it takes care of all the details for you across many sensors,” Mandl explains.
Currently, most satellites are each controlled separately from the others, each one dauntingly complex to use. But starting with NASA’s Earth Observing-1 (EO-1) satellite, part of the agency’s New Millennium Program, Mandl and his team are building a prototype that stitches these satellites together into a seamless, easy-to-use network called “Sensor Web 2.0.”
The vision is to simply enter a location anywhere on Earth into the website’s search field along with the desired information types — wildfire maps, vegetation types, floodwater salinity, oil spill extent — and software written by the team goes to work.
“Not only will it find the best sensor, but with proper access rights, you could actually trigger a satellite to take an image in the area of interest,” Mandl says. Within hours, the software will send messages to satellites instructing them to gather the needed data, and then download and crunch that raw data to produce easy-to-read maps.
For example, during the recent crisis in Myanmar (Burma) caused by Cyclone Nargis, an experimental gathering of data was triggered through Sensor Web 2.0 using a variety of NASA satellites including EO-1. “One thing we might wish to map is the salinity of flood waters in order to help rescue workers plan their relief efforts,” Mandl says. If the floodwater in an area was salty, aid workers would need to bring in bottled water, but if flood water was fresh, water purifiers would suffice. An early and correct decision could save lives.
Thus far, Mandl and his team have expanded Sensor Web 2.0 beyond EO-1 to include three other satellites and an unmanned aircraft. He hopes to double the number of satellites in the network every 18 months, eventually weaving the jumble of satellites circling overhead into a web of sensors with unprecedented power to observe and understand our ever-changing planet.
To learn more about the EO-1 sensor web initiatives, go to http://eo1.gsfc.nasa.gov/new/extended/sensorWeb/sensorWeb.html. Kids (and grown-ups) can get an idea of the resolution of EO-1’s Hyperion Imager and how it can distinguish among species of trees—from space at http://spaceplace.nasa.gov/en/kids/eo1_1.shtml.
This article was provided by the Jet Propulsion Laboratory, California Institute of Technology, under a contract with the National Aeronautics and Space Administration.
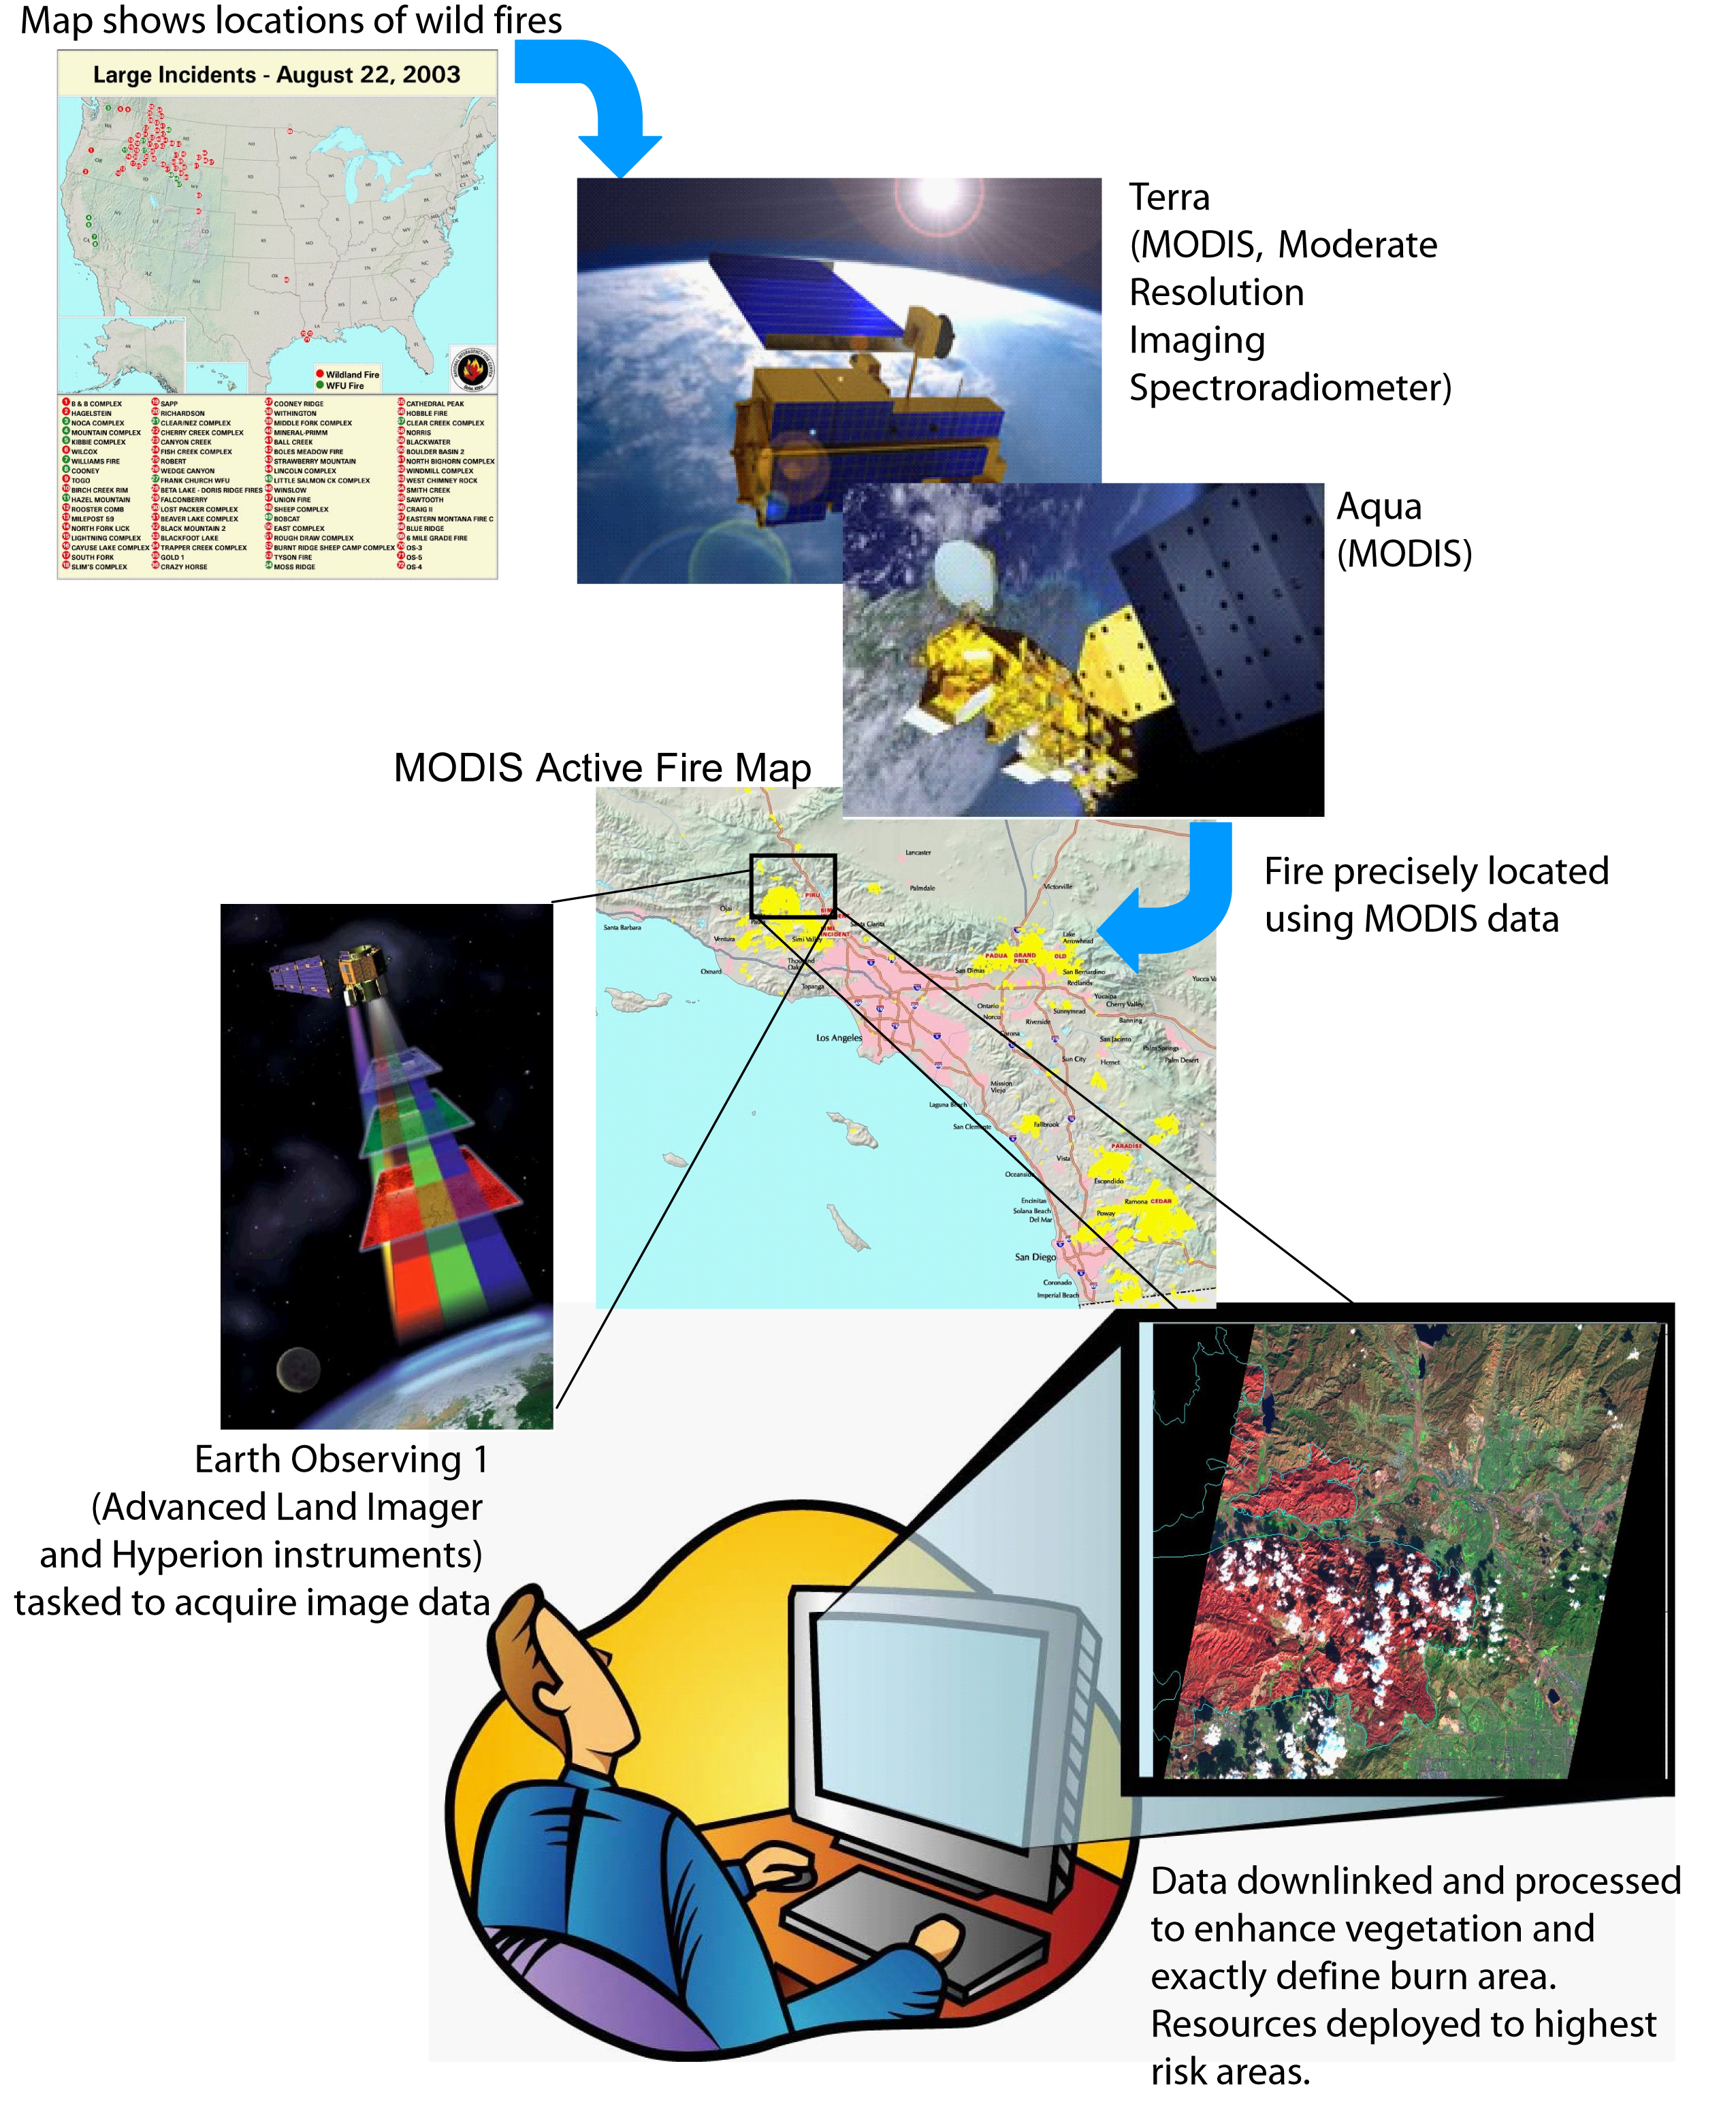 A “Google for satellites” type of web portal will allow users to request real-time data from Earth observing satellites.
Nov. 1, 2008
Exploding Comet
by Dr. Tony Phillips
One year after Comet 17P/Holmes shocked onlookers by exploding in the night sky, researchers are beginning to understand what happened.
“We believe that a cavern full of ice, located as much as 100 meters beneath the crust of the comet’s nucleus, underwent a change of phase,” says Bill Reach of NASA's Spitzer Science Center at the California Institute of Technology. “Amorphous ice turned into crystalline ice” and, in the transition, released enough heat to cause Holmes to blow its top.
Anyone watching the sky in October 2007 will remember how the comet brightened a million-fold to naked-eye visibility. It looked more like a planet than a comet—strangely spherical and utterly lacking a tail. By November 2007, the expanding dust cloud was larger than Jupiter itself, and people were noticing it from brightly-lit cities.
Knowing that infrared telescopes are particularly sensitive to the warm glow of comet dust, Reach and colleague Jeremie Vaubaillon, also of Caltech, applied for observing time on the Spitzer Space Telescope—and they got it. “We used Spitzer to observe Comet Holmes in November and again in February and March 2008,” says Reach.
The infrared glow of the expanding dust cloud told the investigators how much mass was involved and how fast the material was moving. “The energy of the blast was about 1014 joules and the total mass was of order 1010 kg.” In other words, Holmes exploded like 24 kilotons of TNT and ejected 10 million metric tons of dust and gas into space.
These astonishing numbers are best explained by a subterranean cavern of phasechanging ice, Reach believes. “The mass and energy are in the right ballpark,” he says, and it also explains why Comet Holmes is a “repeat exploder.”
Another explosion was observed in 1892. It was a lesser blast than the 2007 event, but enough to attract the attention of American astronomer Edwin Holmes, who discovered the comet when it suddenly brightened. Two explosions (1892, 2007) would require two caverns. That’s no problem because comets are notoriously porous and lumpy. In fact, there are probably more than two caverns, which would mean Comet Holmes is poised to explode again.
When?
“The astronomer who can answer that question will be famous!” laughs Vaubaillon.
“No one knows what triggered the phase change,” says Reach. He speculates that maybe a comet-quake sent seismic waves echoing through the comet’s caverns, compressing the ice and changing its form. Or a meteoroid might have penetrated the comet’s crust and set events in motion that way. “It’s still a mystery.”
But not as much as it used to be.
See more Spitzer images of comets and other heavenly objects at www.spitzer.caltech.edu. Kids and grownups can challenge their spatial reasoning powers by solving Spitzer infrared “Slyder” puzzles at http://spaceplace.nasa.gov/en/kids/spitzer/slyder.
This article was provided by the Jet Propulsion Laboratory, California Institute of Technology, under a contract with the National Aeronautics and Space Administration.
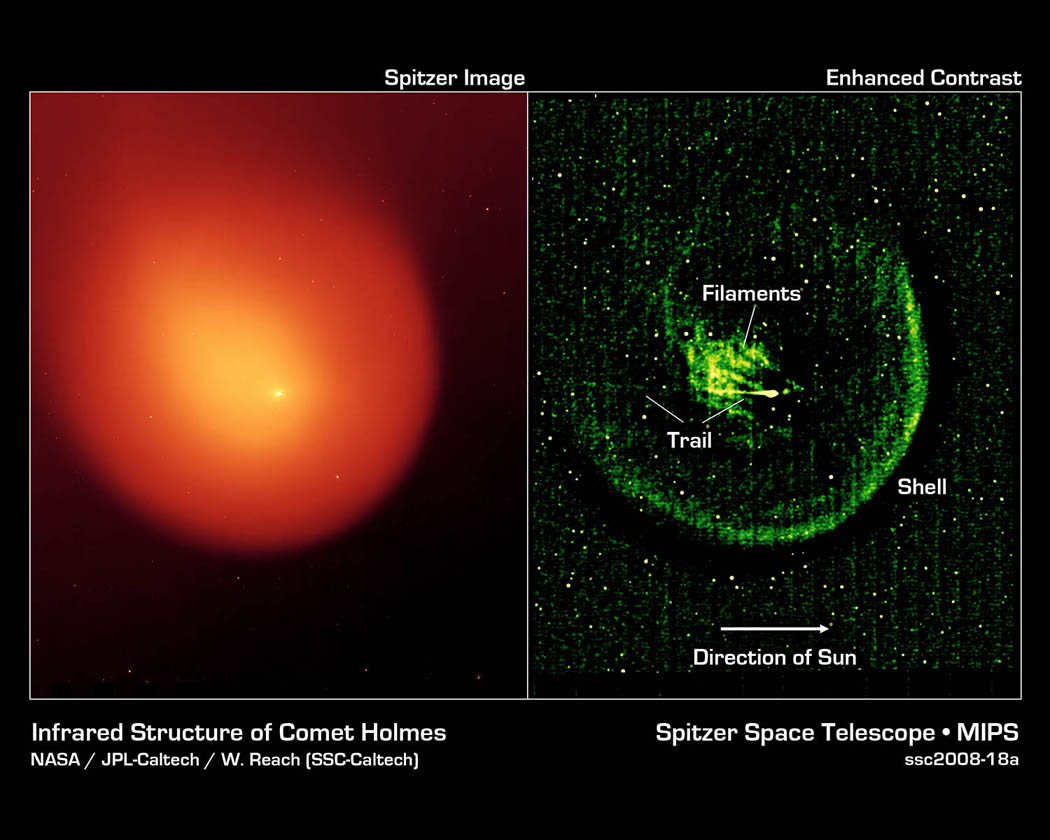 Comet Holmes in infrared on left, and with enhanced contrast on right, showing comet’s outer shell and strange filaments of dust.