Next Launch
Total Students
2,609
Total Launches
683
Eggs Survived
418 61.2%
Rockets Survived
536 78.5%
May 1, 2015
The "G" in GOES Is What Makes It Go
by Ethan Siegel
Going up into space is the best way to view the universe, eliminating all the distortionary effects of weather, clouds, temperature variations and the atmosphere's airflow all in one swoop. It's also the best way, so long as you're up at high enough altitudes, to view an entire 50 percent of Earth all at once. And if you place your observatory at just the right location, you can observe the same hemisphere of Earth continuously, tracking the changes and behavior of our atmosphere for many years.
The trick, believe it or not, was worked out by Kepler some 400 years ago! The same scientist who discovered that planets orbit the sun in ellipses also figured out the relationship between how distant an object needs to be from a much more massive one in order to have a certain orbital period. All you need to know is the period and distance of one satellite for any given body, and you can figure out the necessary distance to have any desired period. Luckily for us, planet Earth has a natural satellite - the moon - and just from that information, we can figure out how distant an artificial satellite would need to be to have an orbital period that exactly matches the length of a day and the rotational speed of Earth. For our world, that means an orbital distance of 42,164 km (26,199 miles) from Earth's center, or 35,786 km (22,236 miles) above mean sea level.
We call that orbit geosynchronous or geostationary, meaning that a satellite at that distance always remains above the exact same location on our world. Other effects - like solar wind, radiation pressure and the moon - require onboard thrusters to maintain the satellite's precisely desired position above any given point on Earth's surface. While geostationary satellites have been in use since 1963, it was only in 1974 that the Synchronous Meteorological Satellite (SMS) program began to monitor Earth's weather with them, growing into the Geostationary Operational Environmental Satellite (GOES) program the next year. For 40 years now, GOES satellites have monitored the Earth's weather continuously, with a total of 16 satellites having been launched as part of the program. To the delight of NASA (and Ghostbusters) fans everywhere, GOES-R series will launch in 2016, with thrice the spectral information, four times the spatial resolution and five times the coverage speed of its predecessors, with many other improved capabilities. Yet it's the simplicity of gravity and the geostationary "G" in GOES that gives us the power to observe our hemisphere all at once, continuously, and for as long as we like!
This article was provided by the Jet Propulsion Laboratory, California Institute of Technology, under a contract with the National Aeronautics and Space Administration.
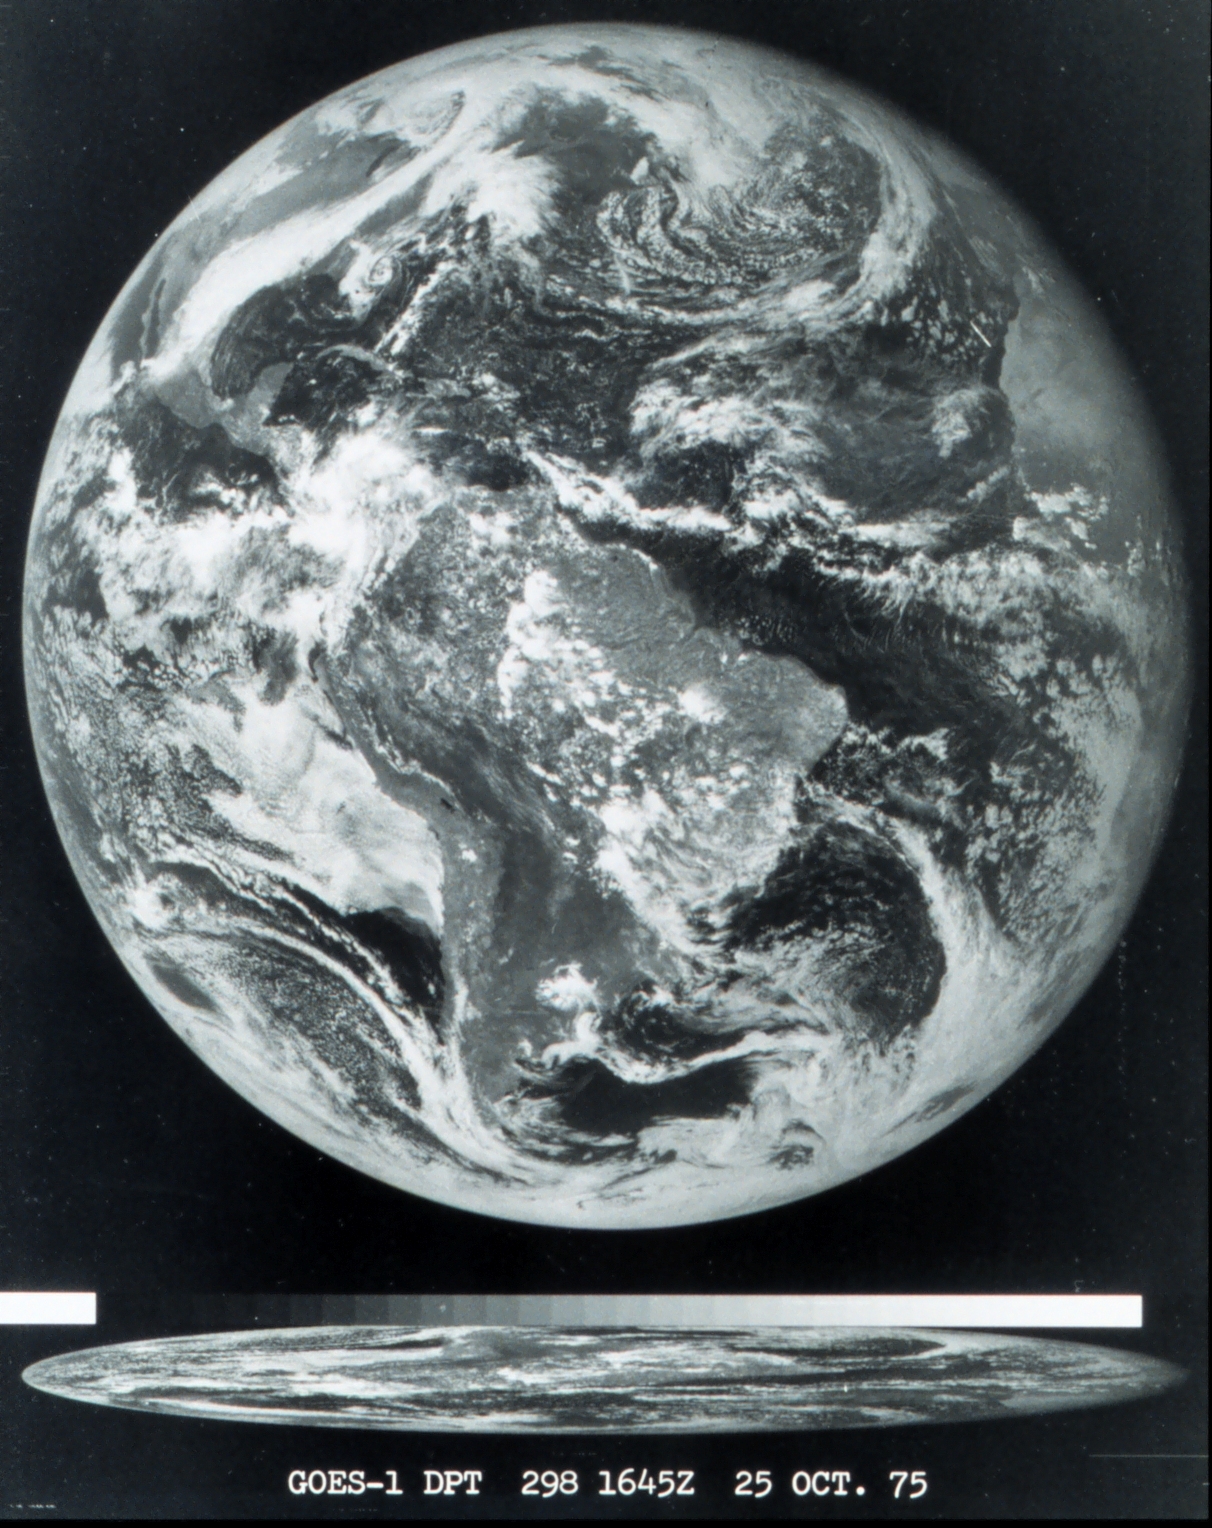 Image credit: National Oceanic and Atmospheric Administration, of the first image ever obtained from a GOES satellite. This image was taken from over 22,000 miles (35,000 km) above the Earth's surface on October 25, 1975.
June 1, 2015
No Surprise! Earth's Strongest Gravity Lies Atop The Highest Mountains
by Ethan Siegel
Put more mass beneath your feet and feel the downward acceleration due to gravity increase. Newton's law of universal gravitation may have been superseded by Einstein's, but it still describes the gravitational force and acceleration here on Earth to remarkable precision. The acceleration you experience is directly proportional to the amount of mass you "see," but inversely proportional to the distance from you to that mass squared.
The denser the mass beneath your feet, the stronger the gravitational force, and when you are closer to such a mass, the force is even greater. At higher elevations or even higher altitudes, you'd expect your gravitational force to drop as you move farther from Earth's center. You'd probably also expect that downward acceleration to be greater if you stood atop a large mountain than if you flew tens of thousands of feet above a flat ocean, with nothing but ultra-light air and liquid water beneath you for all those miles. In fact this is true, but not just due to the mountain's extra mass!
Earth is built like a layer-cake, with the less dense atmosphere, ocean, and crust floating atop the denser mantle, which in turn floats atop the outer and inner cores of our planet. An iceberg's buoyancy is enough to lift only about one tenth of it above the sea, with the other nine tenths below the surface. Similarly, each and every mountain range has a corresponding "invisible mountain" that dips deep into the mantle. Beneath the ocean floor, Earth's crust might be only three to six miles thick, but it can exceed 40 miles in thickness around major mountain ranges like the Himalayas and the Andes. It's where one of Earth's tectonic plates subducts beneath another that we see the largest gravitational anomalies: another confirmation of the theory of continental drift.
A combination of instruments aboard NASA's Gravity Recovery and Climate Experiment (GRACE) satellites, including the SuperSTAR accelerometer, the K-band ranging system and the onboard GPS receiver, have enabled the construction of the most accurate map of Earth's gravitational field ever: to accelerations of nanometers per second squared. While the mountaintops may be farther from Earth's center than any other point, the extra mass of the mountains and their roots - minus the mass of the displaced mantle - accounts for the true gravitational accelerations we actually see. It's only by the grace of these satellites that we can measure this to such accuracy and confirm what was first conjectured in the 1800s: that the full layer-cake structure of Earth must be accounted for to explain the gravity we experience on our world!
This article was provided by the Jet Propulsion Laboratory, California Institute of Technology, under a contract with the National Aeronautics and Space Administration.
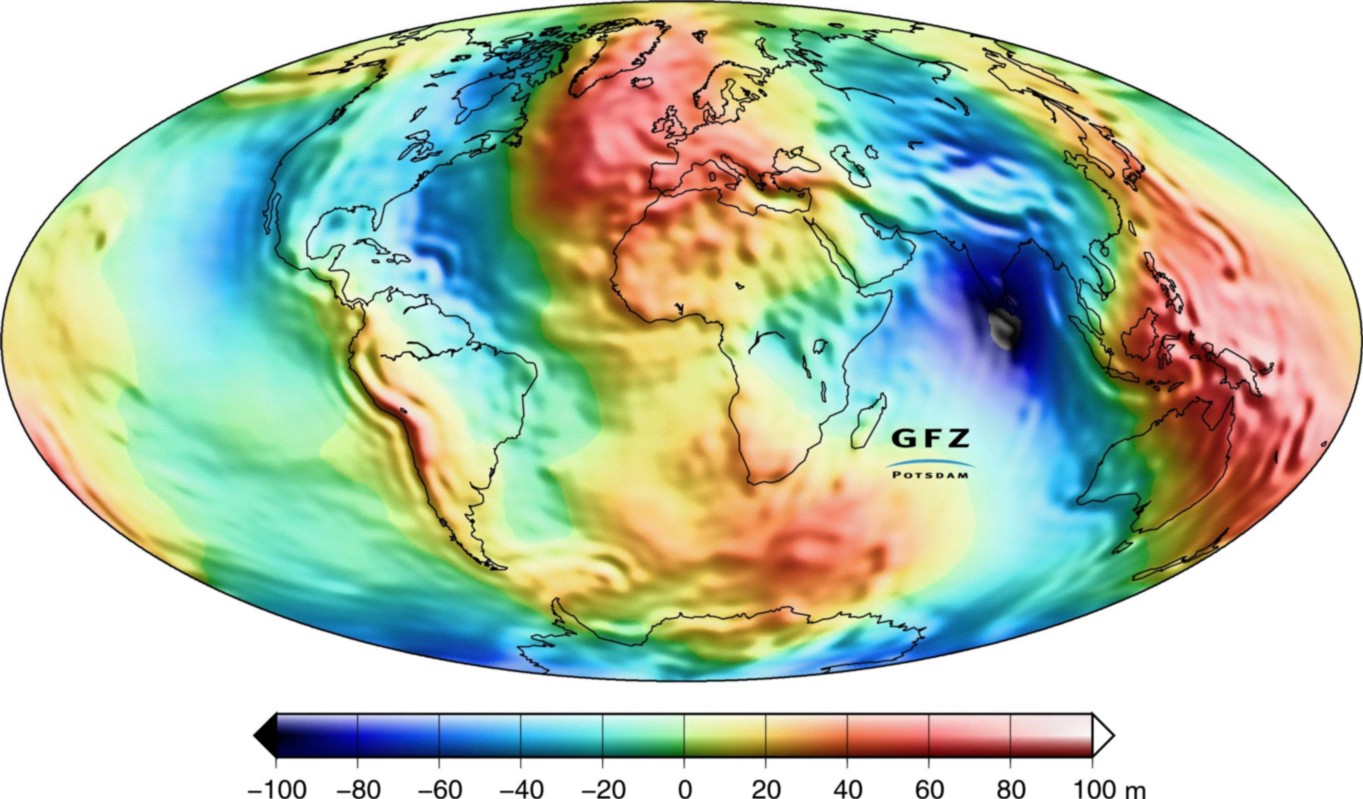 Image credit: NASA / GRACE mission / Christoph Reigber, et al. (2005): An Earth gravity field model complete to degree and order 150 from GRACE: EIGEN-GRACE02S, Journal of Geodynamics 39(1),1?10. Reds indicate greater gravitational anomalies; blues are smaller ones.
July 1, 2015
On The Brightness Of Venus
by Ethan Siegel
Throughout the past few months, Venus and Jupiter have been consistently the brightest two objects visible in the night sky (besides the moon) appearing in the west shortly after sunset. Jupiter is the largest and most massive planet in the solar system, yet Venus is the planet that comes closest to our world. On June 30th, Venus and Jupiter made their closest approach to one another as seen from Earth - a conjunction - coming within just 0.4° of one another, making this the closest conjunction of these two worlds in over 2,000 years.
And yet throughout all this time, and especially notable near its closest approach, Venus far outshines Jupiter by 2.7 astronomical magnitudes, or a factor of 12 in apparent brightness. You might initially think that Venus's proximity to Earth would explain this, as a cursory check would seem to show. On June 30th Venus was 0.5 astronomical units (AU) away from Earth, while Jupiter was six AU away. This appears to be exactly the factor of 12 that you need.
Only this doesn't explain things at all! Brightness falls off as the inverse square of the distance, meaning that if all things were equal, Venus ought to seem not 12 but 144 times brighter than Jupiter. There are three factors in play that set things back on the right path: size, albedo, and illumination. Jupiter is 11.6 times the diameter of Venus, meaning that despite the great difference in distance, the two worlds spanned almost exactly the same angular diameter in the sky on the date of the conjunction. Moreover, while Venus is covered in thick, sulfuric acid clouds, Jupiter is a reflective, cloudy world, too. All told, Venus possesses only a somewhat greater visual geometric albedo (or amount of reflected visible light) than Jupiter: 67 percent and 52 percent, respectively. Finally, while Venus and Jupiter both reflect sunlight toward Earth, Jupiter is always in the full (or almost full) phase, while Venus (on June 30th) appeared as a thick crescent.
All told, it's a combination of these four factors - distance, size, albedo, and the phase-determined illuminated area - that determine how bright a planet appears to us, and all four need to be taken into account to explain our observations.
Don't fret if you missed the Venus-Jupiter conjunction; three more big, bright, close ones are coming up later this year in the eastern pre-dawn sky: Mars-Jupiter on October 17, Venus-Jupiter on October 26, and Venus-Mars on November 3.
Keep watching the skies, and enjoy the spectacular dance of the planets!
This article was provided by the Jet Propulsion Laboratory, California Institute of Technology, under a contract with the National Aeronautics and Space Administration.
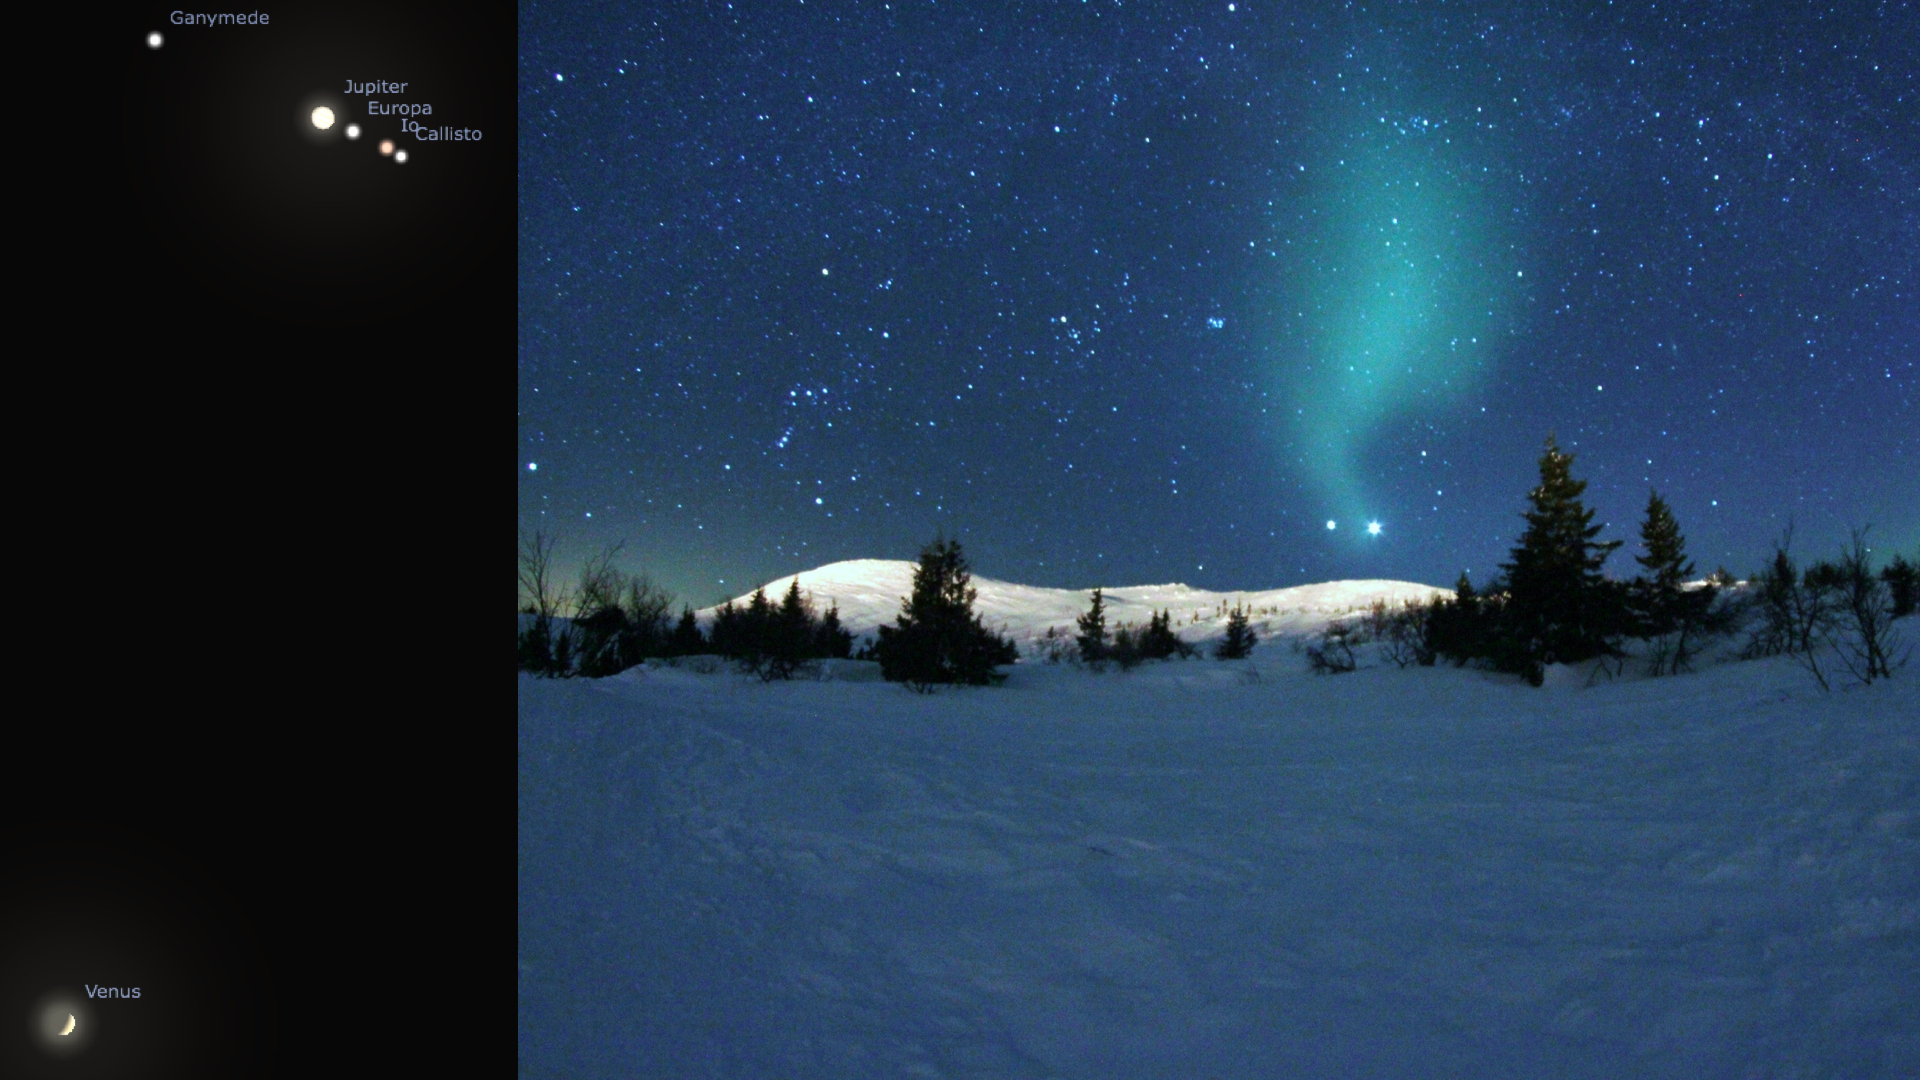 Image credit: E. Siegel, using the free software Stellarium (L); Wikimedia Commons user TimothyBoocock, under a c.c.-share alike 3.0 license (R). The June 30th conjunction (L) saw Venus and Jupiter pass within 0.4° of one another, yet Venus always appears much brighter (R), as it did in this image from an earlier conjunction.
Aug. 1, 2015
Solar Wind Creates-and Whips-a Magnetic Tail Around Earth
by Ethan Siegel
As Earth spins on its axis, our planet's interior spins as well. Deep inside our world, Earth's metal-rich core produces a magnetic field that spans the entire globe, with the magnetic poles offset only slightly from our rotational axis. If you fly up to great distances, well above Earth's surface, you'll find that this magnetic web, called the magnetosphere, is no longer spherical. It not only bends away from the direction of the sun at high altitudes, but it exhibits some very strange features, all thanks to the effects of our parent star.
The sun isn't just the primary source of light and heat for our world; it also emits an intense stream of charged particles, the solar wind, and has its own intense magnetic field that extends much farther into space than our own planet's does. The solar wind travels fast, making the 150 million km (93 million mile) journey to our world in around three days, and is greatly affected by Earth. Under normal circumstances, our world's magnetic field acts like a shield for these particles, bending them out of the way of our planet and protecting plant and animal life from this harmful radiation.
But for every action, there's an equal and opposite reaction: as our magnetosphere bends the solar wind's ions, these particles also distort our magnetosphere, creating a long magnetotail that not only flattens and narrows, but whips back-and-forth in the onrushing solar wind. The particles are so diffuse that collisions between them practically never occur, but the electromagnetic interactions create waves in Earth's magnetosphere, which grow in magnitude and then transfer energy to other particles. The charged particles travel within the magnetic field toward both poles, and when they hit the ionosphere region of Earth's upper atmosphere, they collide with ions of oxygen and nitrogen causing aurora. Missions such as the European Space Agency and NASA Cluster mission have just led to the first accurate model and understanding of equatorial magnetosonic waves, one such example of the interactions that cause Earth's magnetotail to whip around in the wind like so.
The shape of Earth's magnetic field not only affects aurorae, but can also impact satellite electronics. Understanding its shape and how the magnetosphere interacts with the solar wind can also lead to more accurate predictions of energetic electrons in near-Earth space that can disrupt our technological infrastructure. As our knowledge increases, we may someday be able to reach one of the holy grails of connecting heliophysics to Earth: forecasting and accurately predicting space weather and its effects. Thanks to the Cluster Inner Magnetosphere Campaign, Van Allen Probes, Mars Odyssey Thermal Emission Imaging System, Magnetospheric Multiscale, and Heliophysics System Observatory missions, we're closer to this than ever before.
You can learn about how solar wind defines the edges of our solar system at NASA Space Place. http://spaceplace.nasa.gov/interstellar
You can read more about this article at https://www.nasa.gov/mission_pages/ibex/news/spaceweather.html#.Vc9ith9PakD
This article was provided by the Jet Propulsion Laboratory, California Institute of Technology, under a contract with the National Aeronautics and Space Administration.
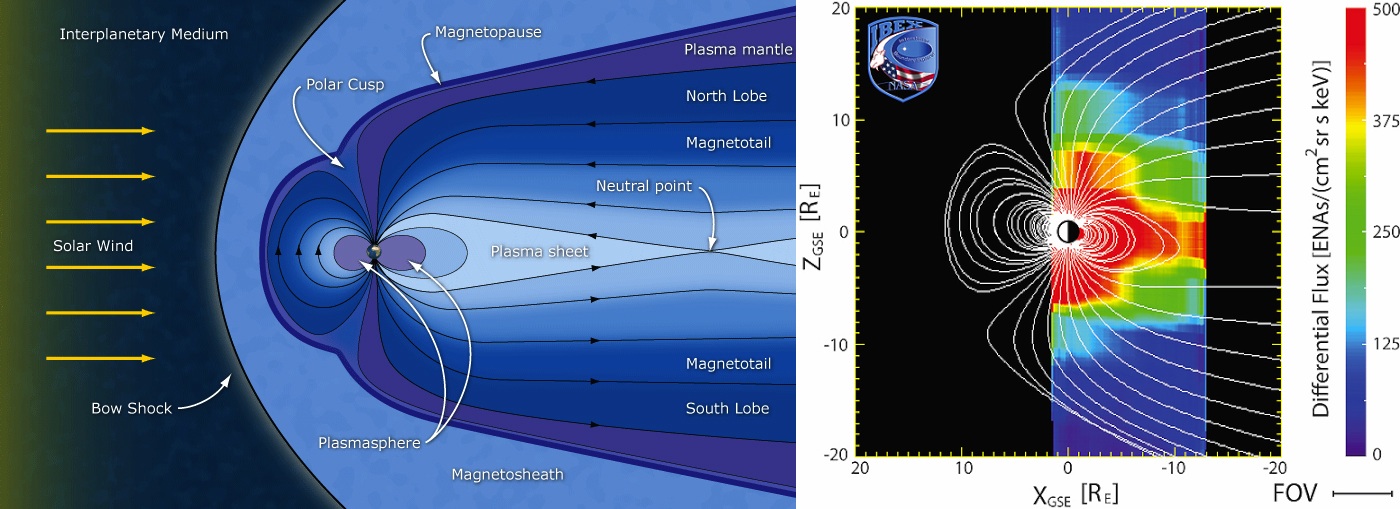 Image credit: ESA / C. T. Russell (L), of Earth's magnetic tail and its cause: the solar wind; Southwest Research Institute / IBEX Science Team (R), of the first image of the plasma sheet and plasmasphere created around Earth by the solar wind.